Introduction
Steel beams with thin walls, so called flexible wall beams, are attractive because of their efficiency in bending operation. However, for these beams, the issue of local stability issue of ensuring local stability becomes very topical. Many theoretical and experimental works are aimed at studying the bearing capacity of such beams, However, most of them are devoted to the behaviour of such elements under the influence of individual force factors. under the influence of single force factors, such as bending, shear and local impact. At the same time, the application of joint shear and local to beams with thin walls. As an example, a steel bridge girder while thrusting on supports or a crane girder in which the girder wall beam is not only locally loaded but also subjected to shear loading.
Such a combination of loads was investigated experimentally by Robertson T.M. and Shahabian F. [1, 2], and Brown B. [3] on welded I-beams with thin wall. These tests showed a significant interaction between shear and local loads. And, as a result, an interaction formula was proposed and a modification of the of the reduced stress method and the effective width method under combined loading [4, 5]. However, the use of analytical formulas is limited by the complexity and area of their application for which they have been experimentally validated. As a rule, due to the complexity of the deformation process of a steel beam taking into account the overcritical stage of behavior when the local stability of the wall is lost, the models of bearing capacity
are conservative [6]. For complex models of bearing capacity and with insufficient The numerical methods, in particular the finite-element method, are efficient for complex models of bearing capacity [6]. methods, in particular the finite element method [7, 8]. At the same time, in normative documents there are only indications of the possibility of using numerical methods for more accurate assessments of behavior and carrying capacity without any specific guidance on model parameters and interpretation of results [9]. In connection with the above, It is of interest to analyze the behavior of steel beams on the basis of computer modeling and comparing the results with in-situ experiments. The application of QE models to evaluate the behavior and values of the load capacity include three basic steps:
- development and unification of the principles and parameters for the construction of QE models;
- assessment of the accuracy of the results based on comparison with experimental
data [10];
- determination of reliability parameters, in particular reliability coefficients,
used to check the limit states [11].
The paper gives an overview of the principles and basic parameters of building FE models of FE models (such as FE grid size, material model, etc.) and their their influence on the result of the FE model, on the basis of which recommendations on methods of of FE model parameters for thin-walled steel structures are made. The analysis of sensitivity of FE models to input parameters (mechanical properties of steel, geometric dimensions) has defined a set of parameters that most considerably influence the on the calculation result and for which it is necessary to lead further studies, and comparison with experimental data showed the efficiency and accuracy of calculations on the basis of on the basis of QE models.
The method Nowadays, numerical simulation is often used due to the lack of real-world experiments or to study thoroughly the influence of different parameters on the performance of the machine. the influence of different parameters, thereby making it possible to evaluate the load-bearing capacity of completely new structural solutions for which there are no computational techniques [12, 13]. In this work, computer modeling is performed using the of finite elements. The basis for creating and studying the accuracy of applying FE models to of thin-walled welded beams is based on The results of experimental researches published in works of Robertson T.M. and Shakhabyan F. [1] and Brown B. [3].
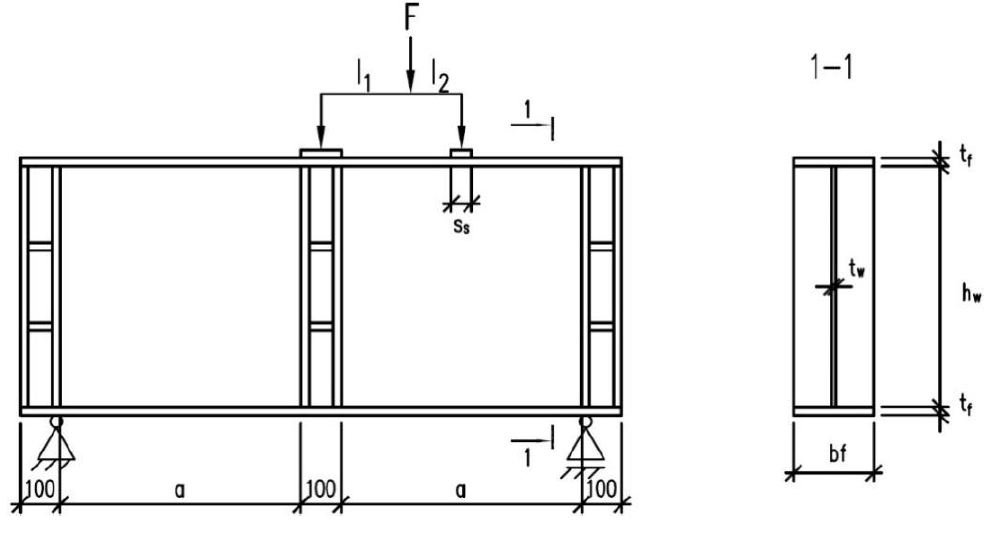
The BE models of the beams were created based on the actually measured geometric and strength characteristics of the beams under test. Two beams from each experiment. Beams marked PG1-2 and PG4-2 were taken from paper [1], from Beams SP600 and SP1200 were taken from [3] (further in the text all references will be made to these girder designations). General diagrams of the simulated beams are shown in Figure 1.
а)
b)
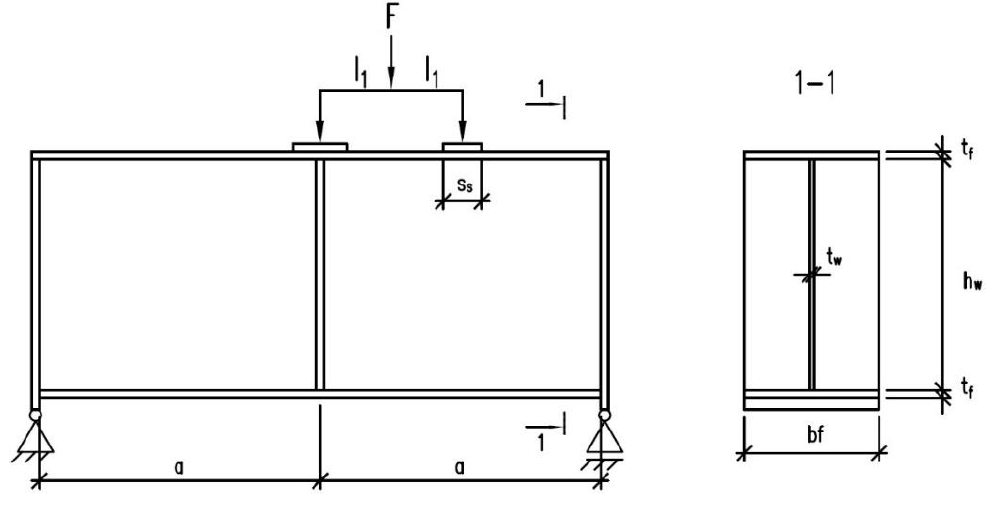
Figure 1 - General schematics of the simulated beams:
(a) experimental scheme of beams PG1-2 and PG4-2, (b) experimental scheme of beams SP600 and SP1200
Table 1 shows the geometric parameters and mechanical properties of the steel of the beams under test. For beams PG1-2 and PG4-2 the stiffening ribs and support plates are 10 mm thickness. Yield strength values are obtained from averaged test data for
Theory of Engineering Structures. Structures № 2 (100) 2022 _________________________________________________________ 29 uniaxial tension of specimens for each beam (three specimens for the wall and two for the flanges). In [1] for beams the measured value of steel tensile strength is not specified, therefore this value is assumed to be fu = 1.35 fy in accordance with the research source [14]. Due to the lack of data, the modulus of elasticity and Poisson's ratio were were assumed to be equal to the generally accepted values of E=210000 MPa and v=0.3, respectively.
For SP600 and SP1200 girders the transversal stiffeners and support plates have the same width and thickness as the flanges. The two samples are made from the same batch of steel. The mechanical properties of the steel obtained from the averaged data of uniaxial tension test specimens (three specimens each for the flanges and wall). Modulus of elasticity for of the wall is equal to E=176938 MPa, for the flanges and ribs is equal to E=186139 MPa. Poisson's coefficient is taken equal to v=0.3.
Table 1 - Geometrical parameters and mechanical properties of steel elements of beams
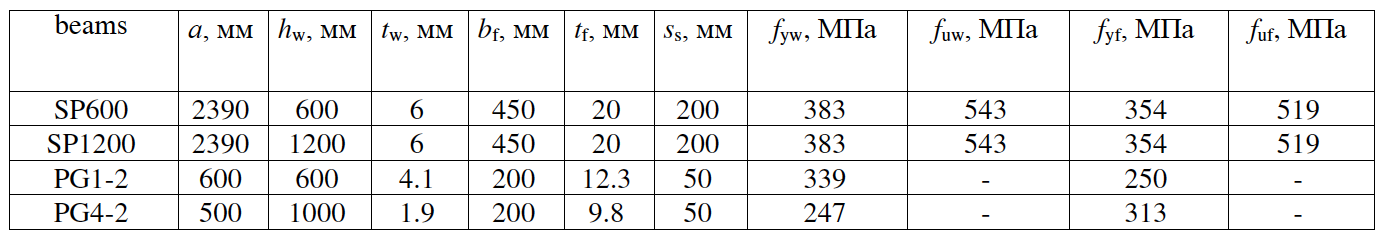
The strength and deformation properties of steel (deformation diagrams) have one of the dominant effects on the bearing capacity of steel structures [15]. The resistance of thin-walled elements can be influenced by taking into account deformation hardening of steel, because in the curved plate, in addition to the primary membrane stresses, secondary bending stresses occur. Using a yield stress diagram can lead to a premature loss of bending stiffness of the plate [16]. In order to analyze the mentioned effects, the following variants of the material model have been considered the following variants of the material model are considered: the bilinear stress-strain relation without stress-strain relations. strain" dependence without strain hardening, bilinear "stress-strain" dependence strain" relation with strain hardening with a slope of E/100 and a four-linear dependence according to the Swedish Standard BSK07 [17] (Figure 2).
Figure 2 - Simulation of material properties according to BSK07
There is also guidance in the regulatory documents SP 16.13330.2017 "Steel structures. Revised edition of SNiP II-23-81*". [18], similar indications are presented in SP 5.04.01-2021 "Steel structures". [19] is in force on the territory of However these materials models are standardized for specific steel grades, so they can't be applied in the territory of the Republic of Belarus. steel grades and therefore can not be applied to the actual values of strength properties of the steel.
Figures 3 and 4 show a comparison of the load-displacement curves for a beam SP600 and PG1-2, respectively, depending on the material model selected. In Figures. Construction and reconstruction are the following designations: V1 - displacement in the center of the beam, V2 - displacement of of upper girder at the place of application of local force. It can be seen that the value of of the limit load is achieved earlier in the deformation diagram of steel without stresses of self-strengthening stage. However, the discrepancy between the results of FE models is of the order of 1%, which corresponds to the fact that all material models are applicable for solving the given problem.
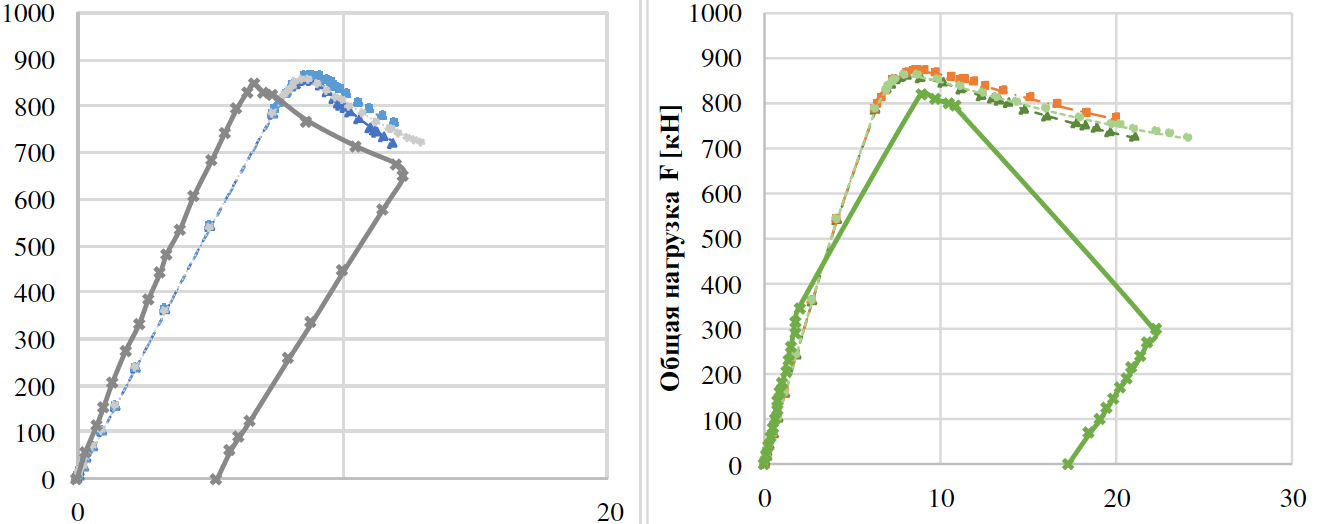
Figure 3 - Comparison of load-displacement curves for the SP600 beam depending on the selected material model
material model
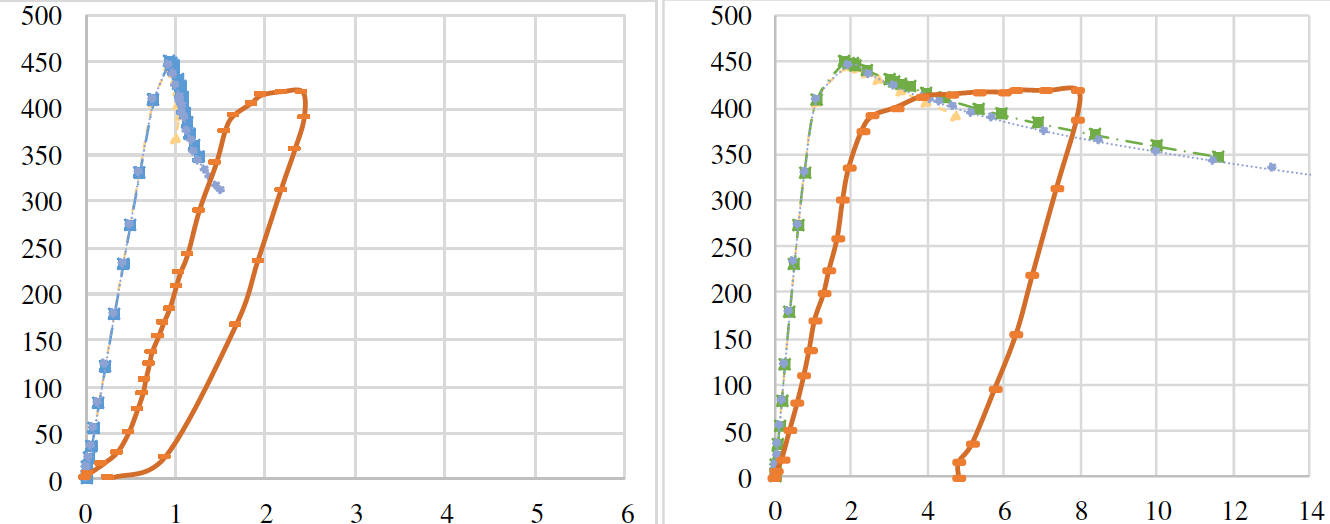
Figure 4 - Comparison of load-displacement curves for beam PG1-2 depending on the selected material model
material model
In the created PE models, the loading dies are modeled by rigid plates of the "discrete rigid" type. The interaction between the dies and the upper flange of a thin-walled element is made through a "surface-to-surface" contact (surface to surface), with the presence of frictional force. The boundary conditions of the supporting ribs are assumed to be articularly immobile on one side and articularly mobile on the other. The loads are taken as static loads, where the loading of the dies is carried out by a concentrated force through a reference point.
The discretization (finite element size) was carried out according to the preliminary analysis on the choice of the finite element size. Figures 5 and 6 plots of the effect of the finite element size on the value of the critical force loss stability and on the value of the limiting force taking into account geometrical and physical nonlinearity for beams SP600 and PG4-2. As a result, the most optimal size in terms of of the solution and the use of computational power, a finite element of the order of five beam wall thicknesses (for beam PG1-2 is 20 mm, for beam PG4-2 is 10 mm and for SP600 and SP1200 beams it is 30 mm).
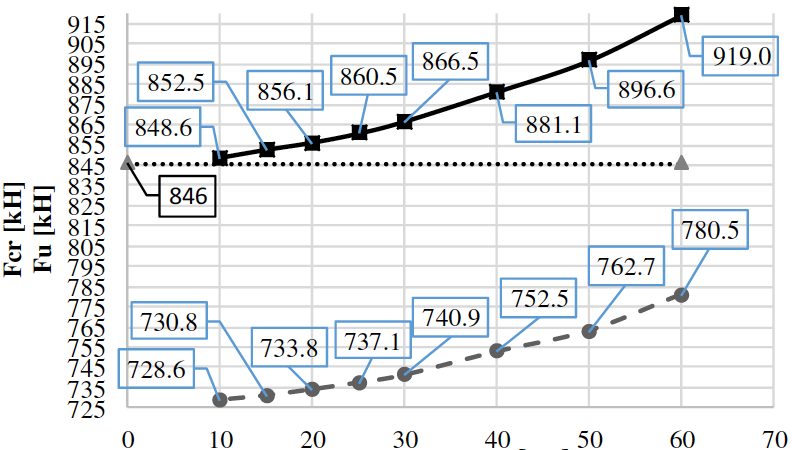
Figure 5 - Finite element sizing analysis for the SP600 beam
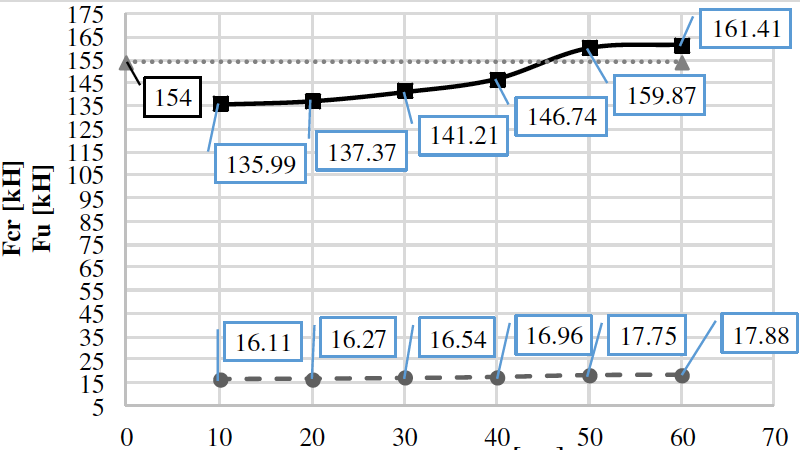
Figure 6 - Finite element sizing analysis for beam PG4-2
The paper considers two options for accounting for imperfections, the first based on eigenforms of stability loss, and the second based on equivalent geometric imperfections [20]. The actual geometric imperfections in the articles are not given in full, and residual stresses have not been measured, so the equivalent geometric imperfections [21, 22]. The shape of the equivalent imperfections is assumed to be semi-sinusoidal with the bending value equal to min (a/200, b/200), so that for beams SP600, PG1-2, PG4-2 the deflection was 3 mm and for beam SP1200 was 6 mm.
The methodology for modeling imperfections based on eigenforms of loss of stability loss is very simple: it is necessary to perform a linear calculation of the stability loss one model to determine the forms of stability loss, then by writing down the results displacements of the beam and using them as initial imperfections of the second model of the same beam, followed by its calculation taking into account the geometric and physical nonlinear work. The values of the imperfections are assumed to be equal as for the equivalent imperfections.
Figures 7 and 8 show the comparison of load-displacement curves for beams SP600 and PG1-2, respectively, depending on the imperfection setting method, where it can it can be seen that the two methods are applicable to the problem at hand. The discrepancy in the ultimate load results between the KE models was of the order of 3%.
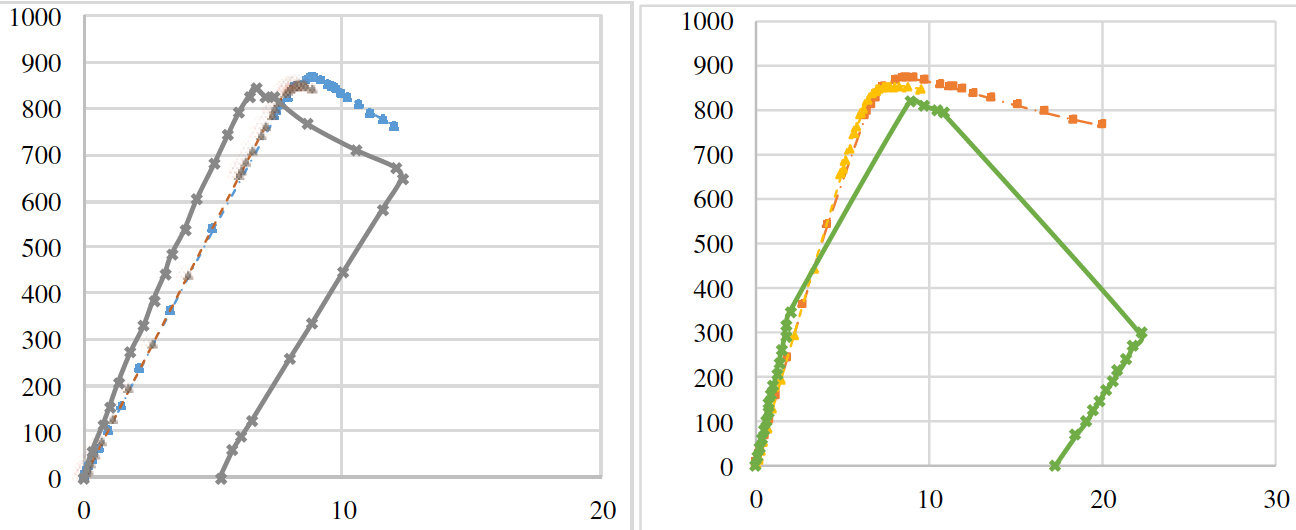
Figure 7 - Comparison of load-displacement curves for the SP600 beam depending on the method of setting
imperfections
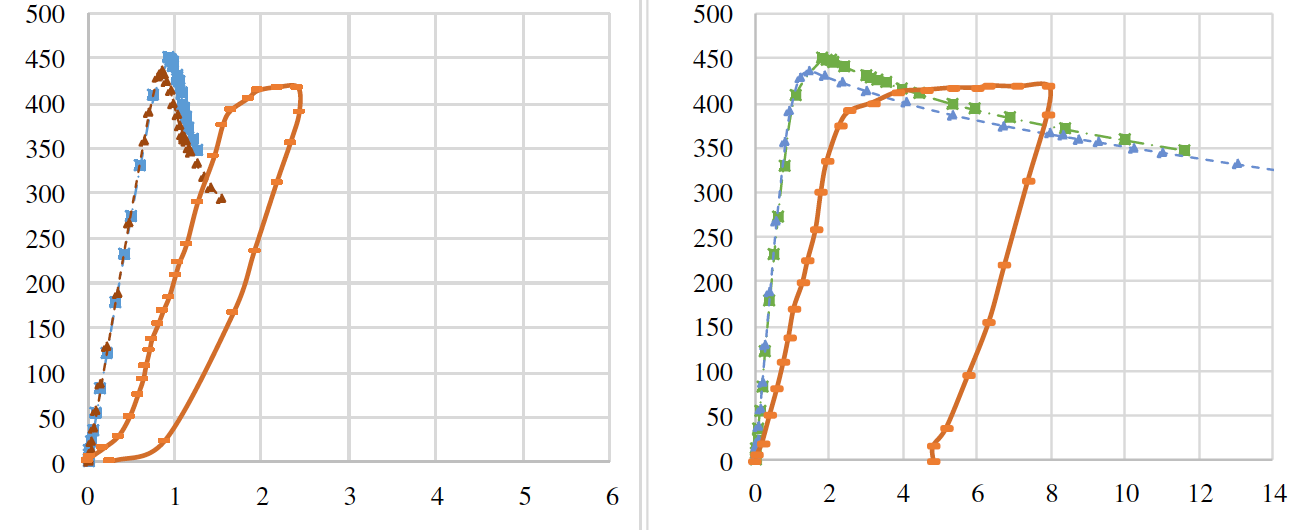
Figure 8 - Comparison of load-displacement curves for beam PG1-2 depending on the way of setting
imperfections
Common to all cross-sectional elements of numerical models is that dimensions are large in two directions and small in the third direction. Thus, geometry degenerates into the notion of an average surface, which is then divided into shell elements. When calculating thin plates, in addition to the nonlinearity of the material (physical nonlinearity), large deformations contribute to geometrically nonlinear effects [23]. As a basic QE element for the construction of section of beams, a four-node shell finite element with the function bilinear form, denoted as S4R.
To carry out the comparative analysis, a three-dimensional solid twenty-node finite element, denoted as C3D20R, was chosen and similar FE models. Figure 9 shows a comparison of the load-displacement curves of the SP600 beam. displacement" curves of the SP600 beam depending on the selected type of finite element. From the it can be seen that the best convergence of the FE model results with experimental data is achieved by using three-dimensional FE. However, the discrepancy in the ultimate load results between the FE models was in the order of 2%.
Therefore, if it is possible to reduce the problem to a planar formulation, it is more appropriate to to use the S4R element, because by applying a C3D20R-type element, the simulation is more time-consuming and more computational power is used.
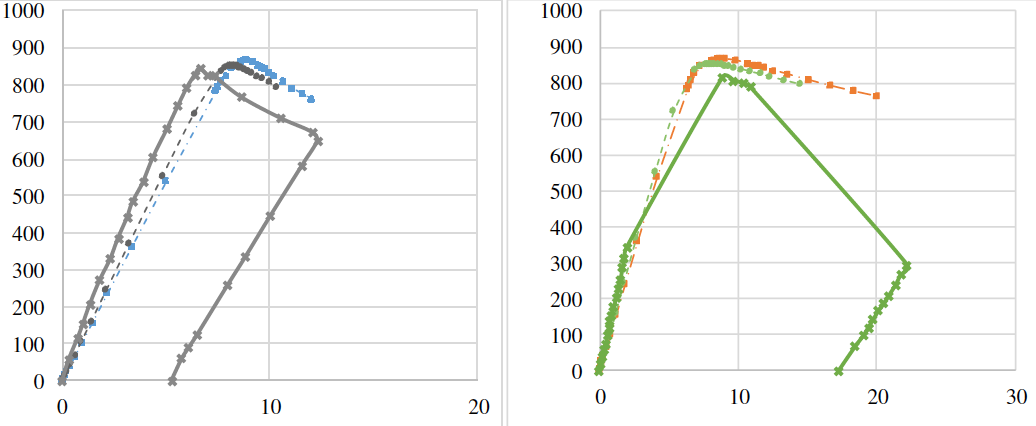
Figure 9 - Comparison of load-displacement curves of SP600 beam depending on the selected type of
finite elements
Results and discussion
After a preliminary setup of FE model parameters, an important step in of FE model design is to analyze model sensitivity to values of input variables (yield strength, modulus of elasticity, wall thickness etc.) etc.) and model parameters (PE mesh size, PE type, etc.) on the results (output variables) of the model [24]. It is necessary to establish at what scatter of input data is the validity of the main conclusions drawn from the simulation results.
When performing a sensitivity analysis on the mechanical properties of steel, the values of yield strength, tensile strength and modulus of elasticity obtained from experimental data, increased and decreased by 10%. The value of yield strength for the SP600 beam after a 10% increase is: for the wall fyw= 422 MPa, and for the flanges and stiffeners - fyf = 389 MPa. Figure 10 shows a comparison of the load-displacement curves of the SP600 girder as a function of the yield strength. displacement" curves of SP600 beam depending on the value of yield strength. Table 2 shows the results of girder calculations after changing the yield strength. This parameter has a significant effect on the value of the ultimate load, but the deformation pattern remains unchanged.
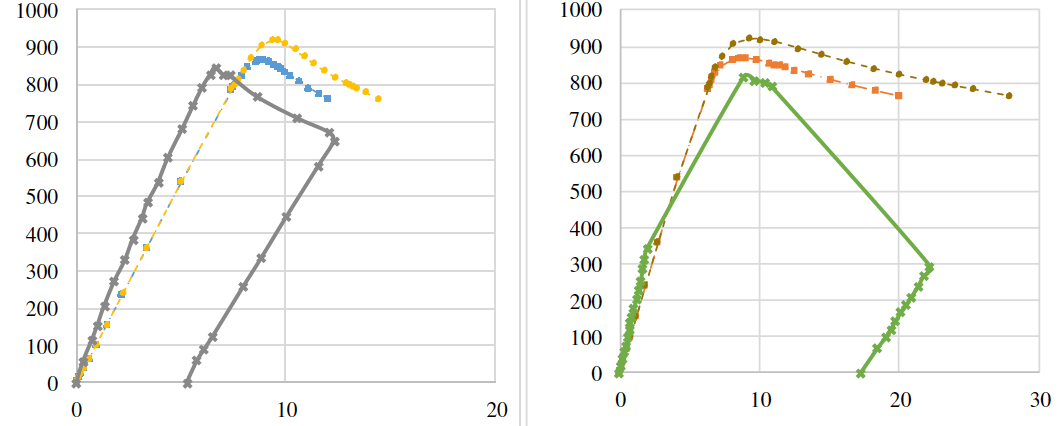
Figure 10 - Comparison of load-displacement curves of SP600 beam as a function of yield strength
yield strength
Table 2 - Sensitivity analysis to yield strength
The value of ultimate strength for SP600 girder after 10% increase for wall is fuw= 597 MPa, and for the flanges and ribs - fuf= 571 MPa. In figure 11 we can see you can see a comparison of the load-displacement curves of the SP600 beam as a function of the of the tensile strength. This parameter does not affect the value of ultimate load.
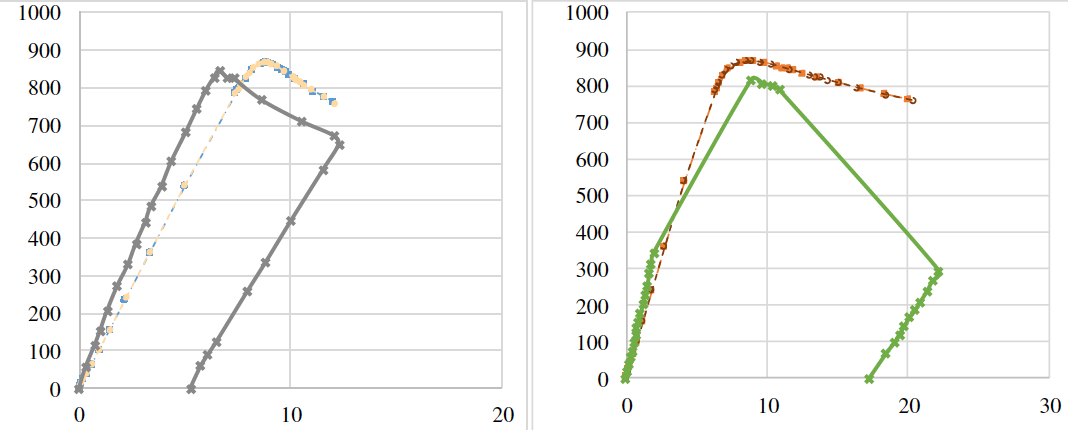
Figure 11 - Comparison of load-displacement curves of SP600 beam as a function of ultimate strength
tensile strength
The value of the modulus of elasticity for the SP600 beam after increasing for the wall is E = 194.6 MPa and for the flanges and ribs, E = 204.7 MPa. In Figure 12 it is possible to see comparison of the load-displacement curves of the SP600 beam as a function of the of the modulus of elasticity. This parameter with this variation does not significantly affect the value of the ultimate load, at which the discrepancy between the QE models is 3%. It is also possible to observe changes in the slope angle of the initial linear section of the curves.
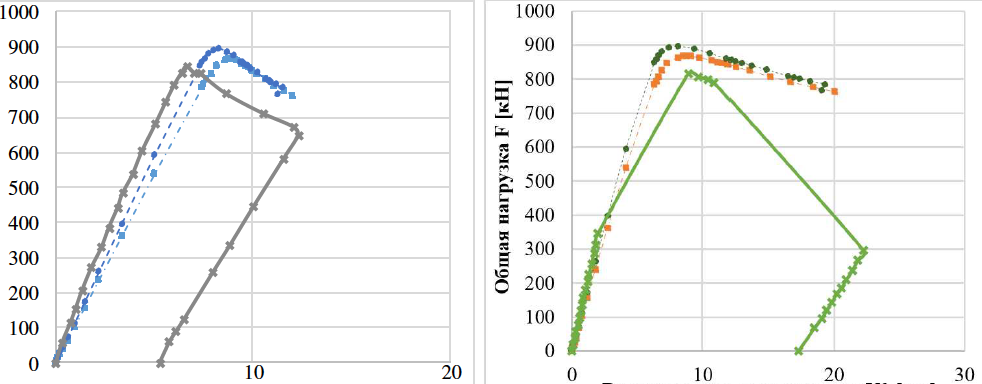
Figure 12 - Comparison of load-displacement curves of SP600 beam as a function of
modulus
When performing a sensitivity analysis of the setting of the geometry of the FE models, the values of wall and flange thicknesses taken from the experimental data were increased and decreased by 10%.
The wall thickness for the SP600 beam after a 10% increase is 6.6 mm. In Fig. 13 you can see a comparison of the load-displacement curves of the SP600 beam as a function of wall thickness values. Table 3 shows the results of girder calculations after wall thickness changes. This parameter significantly affects the value of the ultimate load, but the character of deformation remains unchanged.
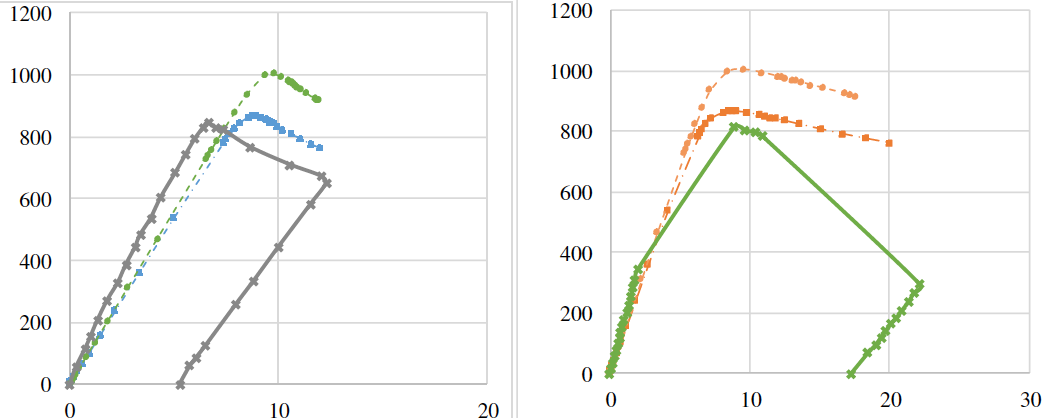
Figure 13 - Comparison of load-displacement curves of SP600 beam depending on wall thickness
wall thickness
Table 3 - Wall thickness sensitivity analysis
The flange thickness for the SP600 girder after a 10% increase is 22 mm. In Figure 14
you can see a comparison of the load-displacement curves of the SP600 beam depending on
of the flange thickness. This parameter, with this change, does not significantly affect the
value of the ultimate load, at which the discrepancy between the QE models is
order of 2% and the character of deformation remains unchanged.
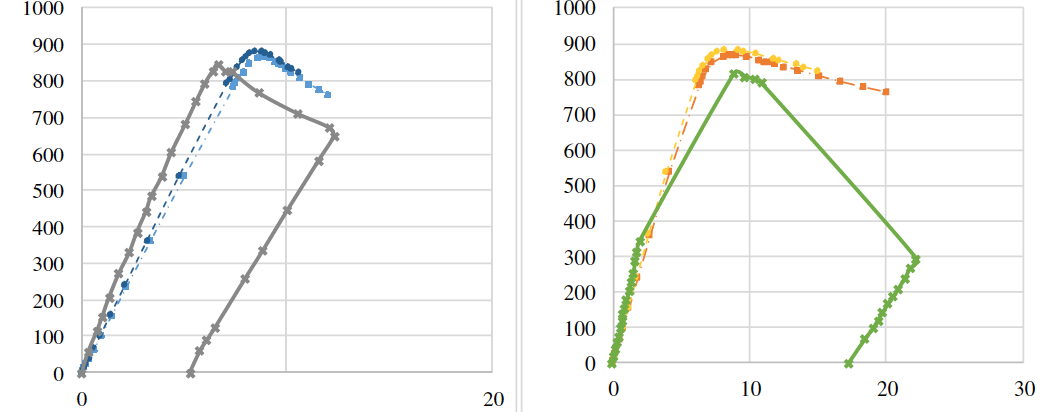
Figure 14 - Comparison of load-displacement curves of SP600 beam depending on
flange thicknesses
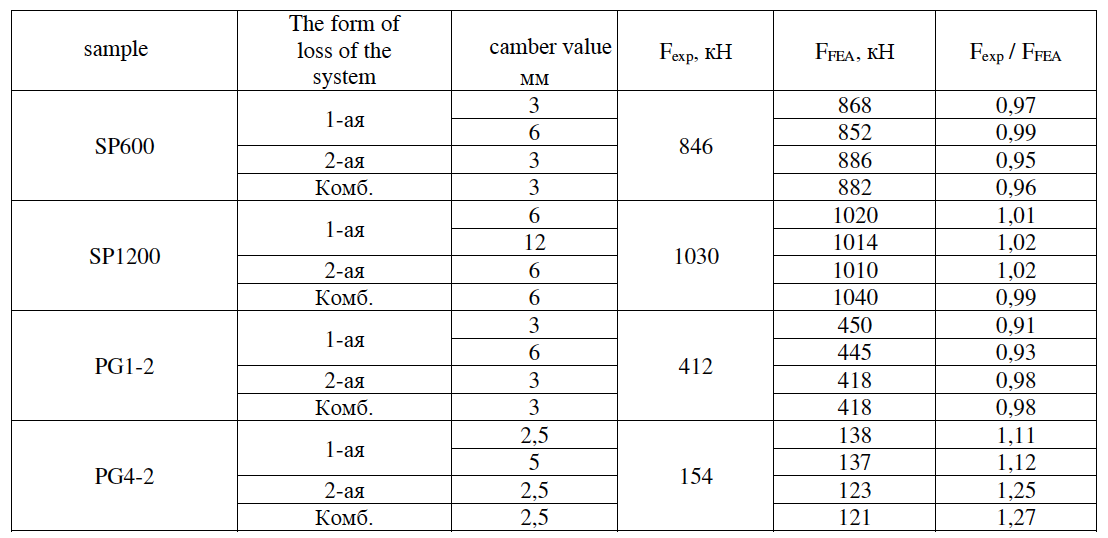
Sensitivity analysis of the initial imperfections set was performed for the 1 - 1stand 2nd form of stability loss and for a combination of forms. Figure 15 shows comparison of load-displacement curves of SP600 beam depending on the form of stability loss of stability loss. Table 4 summarizes the results of girder calculations after changing the form of stability loss. It can be noted that for these beams, the choice between 1st, 2nd and combined form of stability loss does not significantly affect the value of of the ultimate load and on the character of deformation.
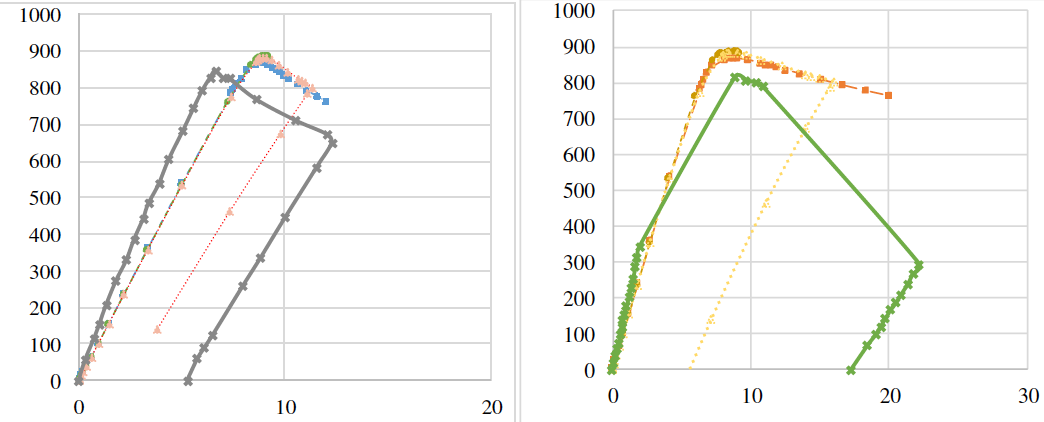
Figure 15 - Comparison of "load-displacement" curves of SP600 beam depending on the form of stability loss
stability
As a sensitivity analysis of the magnitude of imperfection, for beam SP600 at the first form of stability loss, this parameter is assumed to be 6 mm. In Figure 16 we can see that this discrepancy in the magnitude of the imperfection does not significantly affect the value of the ultimate load. Table 4 shows the results of beam calculations after of the imperfection value for the first form of stability loss.
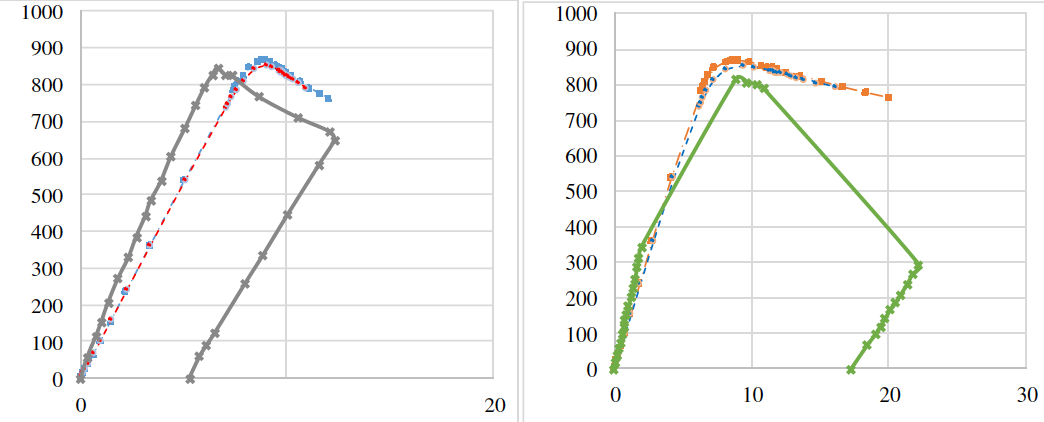
Figure 16 - Comparison of load-displacement curves of SP600 beam depending on
imperfection
Table 4 - Sensitivity analysis of the form of stability loss and magnitude of imperfection
imperfection
As a result, the models were built and data were obtained for comparison with the results of field experiments. The graphs of vertical displacement of beams under joint action of local and shear forces are shown in Figures 17-20.
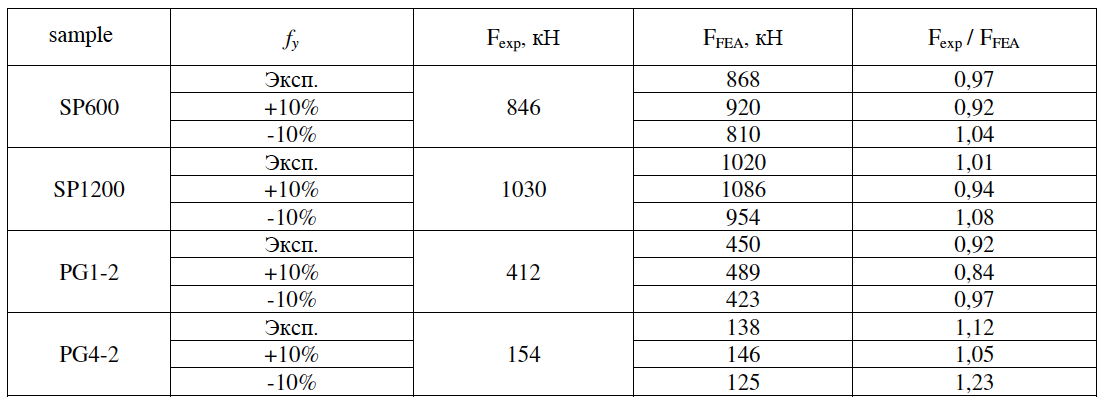
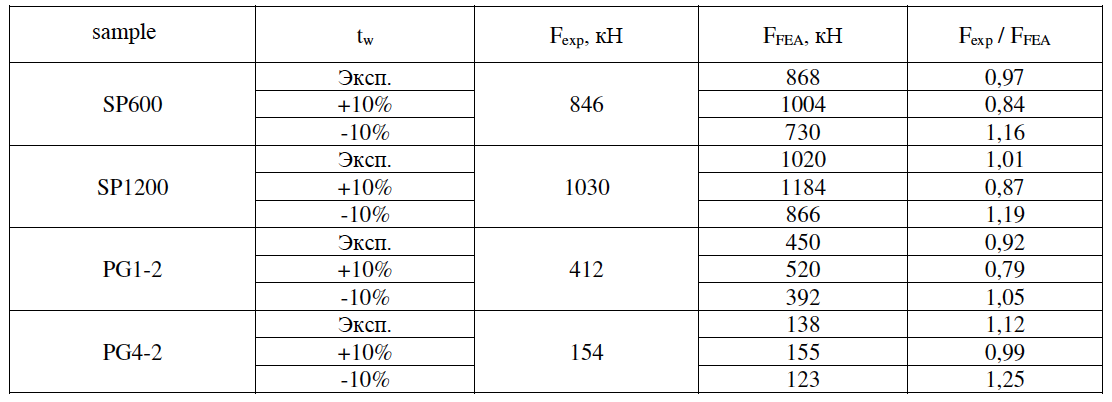
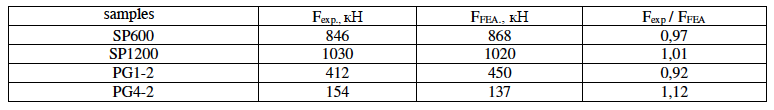
The results of experimental samples and PE models are summarized in Table 5. The models showed a close numerical convergence with the experimental results.
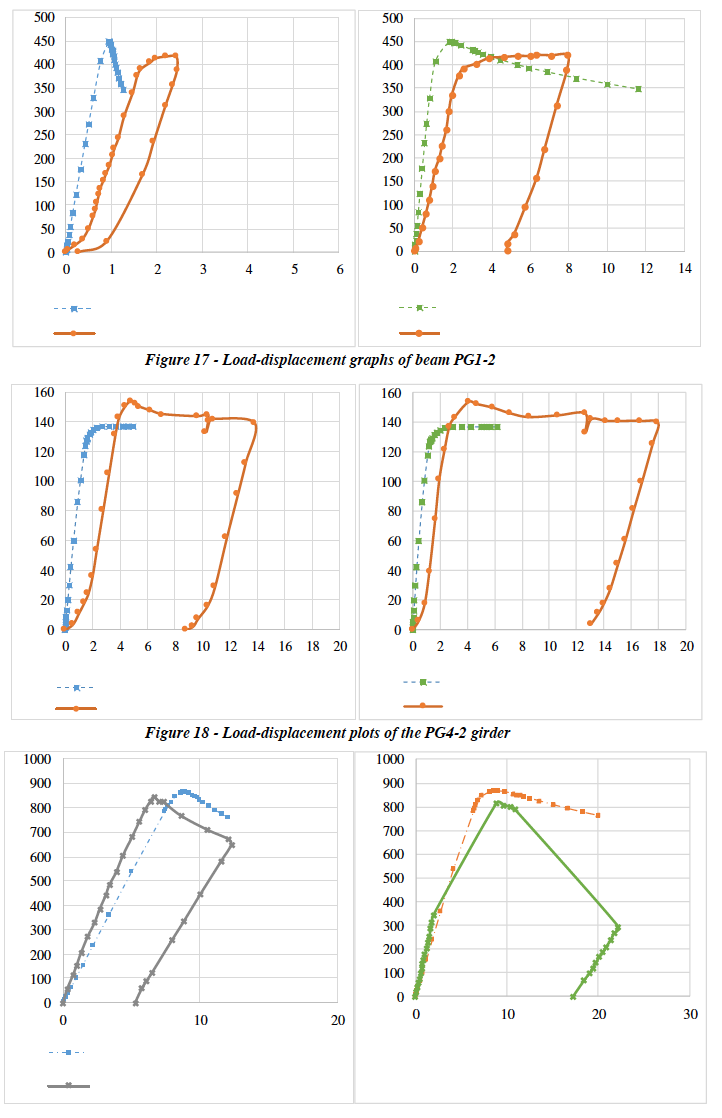
Figure 19 - Load-displacement graphs of the SP600 beam
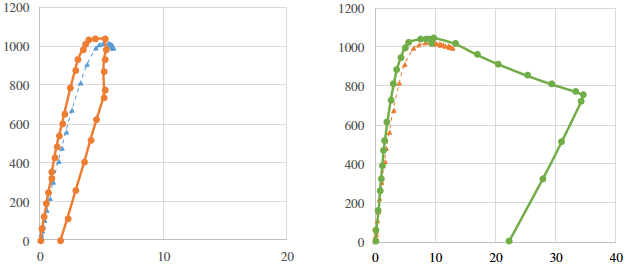
Figure 20 - Load-displacement plots of the SP1200 beam.
Table 5 - Results of experimental samples and QE models
The various assumptions and approximations made in the analysis are listed below:
⎯ The article [1] did not specify all the mechanical properties of the steel, so the ultimate
strength was assumed to be fu = 1.35 fy according to studies [14], the modulus
elasticity and Poisson's ratio were taken to be E=210000 MPa and =0.3
respectively.
⎯ This study is limited by the number of specimens to verify
results, which limits the extension of the conclusions to a broader problem area.
⎯ A limited analysis of material models, performed for three models.
⎯ No analysis of sensitivity to eccentricity of force application.
Conclusions
This part presents the basic principles (parameters) of the construction of QE models, which should be observed when estimating bearing capacity of steel of steel elements with flexible walls. The basic parameters influencing the result of modeling thin-walled element modeling are: the choice of the deformation diagram and material properties; the type and size of the finite element; the size and shape of the initial imperfections imperfections. The analysis of influence of parameters of the finite element model on the accuracy of the results is performed. Materials models have been analyzed, on the basis of which it has been suggested to use a 4 linear dependence with the yield point and with self-strengthening stage. The analysis of
of FE mesh sizes showed that the most optimal size is about 5 thicknesses of the element wall. The use of volumetric elements does not lead to a significant increase in accuracy of the model, that is why it is recommended to use shell elements. The setting of imperfections is recommended to be carried out on the basis of the first form of stability.
It can be concluded from the work done that the finite element method is perfectly suitable for solving problems concerning stability of beam walls at The combined load, makes it possible to take into account a wide range of factors when building the model of the model and approximate the real experimental data.
Analysis of sensitivity of FE model to input variables showed that the greatest sensitivity is related to the variability of wall thickness (a ±10% change in the load carrying capacity changes by ±10%). ±of the load capacity changes by ±16%) and yield strength (a ±10% change in the yield strength changes by ±7%), consequently, the variability of these variables must be controlled during the production of the steel girders in the first instance and must be taken into account when determining and regulating partial coefficients. It should be noted that in addition to the research on the principles of constructing QE models and their verification with experimental data, further research It is necessary to pay due attention to the development of limit states criteria and of reliability parameters coordinated with the concept of design on the basis of QE models [25, 26].
Список литературы
- Roberts T. M., Shahabian F. Combined Shear and Patch Loading of Plate Girders. Journal of Structural Engineering, ASCE. 2000. Vol. 126. No. 3. Pp. 316-321.
- Roberts T. M., Shahabian F. Ultimate resistance of slender web panels to combined bending shear and patch loading. Journal of Constructional Steel Research. 2001. Vol. 57 No. 7. Pp. 779-790. ISSN 0143-974X.
- Braun B. Stability of steel plates under combined loading. Mitteilungen: Institut für Konstruktion und Entwurf der Universität Stuttgart, 2010. 226 p.
- Eurocode 3: Design of steel structures. Part 1-5: Plated structural elements. EN1993-1-5. CEN (European Committee for Standardization). Brussels, Belgium: CEN. 2006.
- Johansson B., Maquoi R., Sedlacek G. New design rules for plated structures in Eurocode 3. Journal of Constructional Steel Research. 2001. Vol. 57. Pp. 279–311.
- Надольский В. В., Мартынов Ю.С. Оценка ошибок моделей сопротивления сдвигу, принятых в EN 1993-1-5 и СНиП II-23 // Вестник МГСУ. 2013. № 5. С. 7–20. doi: 10.22227/1997-0935.2013.5.7-20
- Саиян С.Г., Паушкин А.Г. Численное параметрическое исследование напряженно- деформированного состояния двутавровых балок с различными типами гофрированных стенок // Вестник МГСУ. 2021. № 6 (16). С. 676-687.
- Сидоров В. Н., Бадьина Е. С. Нелокальные модели демпфирования в динамических расчетах конструкций из композитных материалов // Промышленное и гражданское строительство. 2021. № 9. С. 66-70.
- Перельмутер А. В., Тур В.В. Готовы ли мы перейти к нелинейному анализу при проектировании // International Journal for Computational Civil and Structural Engineering. 2017. Vol. 13. Issue 3. Pp. 86-102.
- Крылов А. С. Экспериментальная оценка точности расчетов стальных балок при различных граничных условиях // Строительство и реконструкция. 2019. № 1(81). С. 48-55.
- Nadolski V. Á., Rózsás M., Sýkora. Calibrating partial factors - methodology, input data and case study of steel structures. Periodica Polytechnica: Civil Engineering. 2019. Vol. 63. No. 1. Pp. 222-242.
- Мартынов Ю. С., Надольский В. В., Веревка Ф. А. Стеновые панели на основе кассетных профилей. Часть 1. Теоретические исследования // Строительство и реконструкция. 2019. № 4(84). С. 26-37.
- Кузнецов Д. Н., Емельянов Д. И., Павленко Т. М. Силовая сэндвич-панель поэлементной сборки // Строительная механика и конструкции. 2020. № 1(24). С. 70-84.
- Yun X, Gardner L. Stress-strain curves for hot-rolled steels. Journal of Constructional Steel Research. 2017. No. 133. Pp. 36–46.